Token rebounds from session lows with whale accumulation offsetting institutional liquidations, but resistance levels cap momentum.
Updated Sep 4, 2025, 5:03 a.m. Published Sep 4, 2025, 4:58 a.m.
What to know:
- XRP traded in a narrow range from $2.81 to $2.87 over a 24-hour period, with large wallets accumulating 340 million XRP despite significant institutional liquidations.
- Total transaction volume on the XRP Ledger more than doubled on September 1, reaching 2.15 billion XRP.
- Analysts are divided on XRP’s future, with some predicting a rise to $7–$13 and others warning of resistance below key trendlines.
News Background
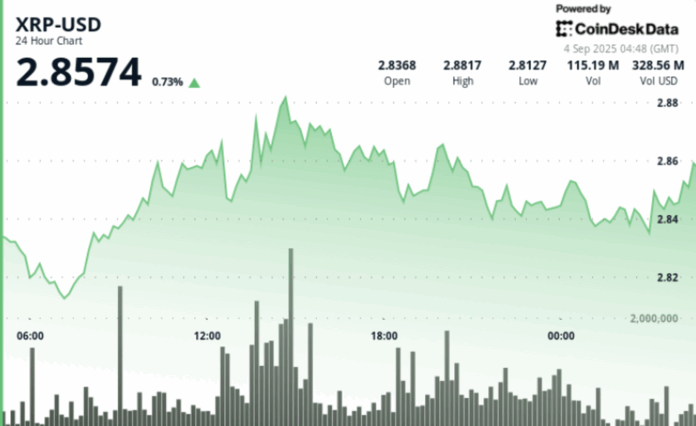
- XRP traded in a narrow 2% range from $2.81 to $2.87 during the 24h session from Sept. 2 at 14:00 to Sept. 3 at 13:00.
- Large wallets accumulated roughly 340M XRP (~$960M) over the past two weeks even as institutions liquidated ~$1.9B since July.
- Total transaction volume across the XRP Ledger reached 2.15B XRP on Sept. 1, more than double typical daily activity.
- Analysts remain split: some highlight long-term bullish structures (symmetrical triangles, Elliott Wave counts) with upside toward $7–$13, while others warn of fading momentum below multi-year resistance trendlines.
Price Action
- XRP opened near $2.84 and closed at $2.85, up slightly despite intraday volatility.
- Price dipped early from $2.84 → $2.79, then rebounded to $2.87 by midday on Sept. 3.
- Support developed at $2.82, repeatedly attracting bids.
- Resistance capped upside near $2.86, where distribution pressure intensified.
- Final-hour trading saw a reversal: a spike to $2.873 (12:38 GMT) on 5.38M volume was rejected, pushing price back under $2.85.
Technical Analysis
- Support: $2.82 zone remains the key demand area. Below that, $2.70 and $2.50 are next.
- Resistance: $2.86–$2.88 continues to act as overhead supply. $3.00 is the psychological hurdle, with $3.30 as breakout confirmation.
- Momentum: RSI steady in mid-50s, showing neutral bias with slight bullish lean.
- MACD: Histogram converging toward bullish crossover, signaling momentum could strengthen if volume persists.
- Patterns: Symmetrical triangle consolidation under $3.00 intact. Break above $3.30 unlocks higher targets.
- Volume: Session surges (93M–95M vs 44M avg) point to active institutional flows.
What Traders Are Watching
- Whether $2.82 support holds under renewed pressure.
- A decisive close above $2.86–$2.88, then $3.00 and $3.30 for a breakout setup.
- Whale flows: continued accumulation versus ongoing institutional selling.
- Regulatory and macro catalysts, including Fed policy and pending SEC clarity, which could shift sentiment quickly.
More For You
Figma’s $91M Bitcoin Bet Isn’t a ‘Michael Saylor’ Move, CEO Says
CEO Dylan Field distanced the company’s crypto position from evangelist extremes, saying bitcoin is part of a diversified cash approach.
What to know:
- In its first earnings report since going public in July, Figma revealed it now holds $91 million in bitcoin, part of its $1.6 billion cash reserves.
- The company CEO framed the move as a modest part of a broader treasury strategy, not a pivot to crypto speculation.
- Despite beating earnings expectations, Figma’s stock fell 18% Thursday, continuing a post-IPO slide.


